Project:
Rephetio: Repurposing drugs on a hetnet [rephetio]

Describing Hetionet v1.0 through visualization and statistics


We have finished building the hetnet for Project Rephetio, which we've named Hetionet. As we gear up for the version 1.0 release, we'd like to provide statistics and visualizations to help users appreciate the network. Here we'll discuss ways to communicate hetnet topology and showcase our current visualizations.

Here are some points to keep in mind:

  • the hetnet, which consists of 47,031 nodes of 11 types and 2,250,197 edges of 24 types, will break most existing visualization software
  • we prefer approaches that are automatable: we're looking for sustainable and versatile solutions

Metagraph

A metagaph is the graph of types in a hetnet. In Neo4j speak, metagraphs are often referred to as "data models". Another synonymous term is "network schema". Here is the metagraph for Hetionet v1.0:

Hetionet v1.0 Metagraph

Metagraphs show what types of entities and relationships are included in the network. However by design, they don't provide any information on the actual nodes or edges.

Circular metanode layout

One of our primary methods for showing the actual hetnet has been a layout which groups nodes by their type. For each metanode, nodes are laid out in circles. Edges are colored by their type. Here is the circular metanode layout for Hetionet:

Hetionet v1.0 Circular Metanode Layout

This method of visualization gives users a bird's eye view of the hetnet. It begins to show certain summary statistics, such as the number of nodes per metanode. It also weakly illustrates whether a metaedge is concentrated to a few high degree nodes or is well dispersed. However, this visualization is primarily meant to be aesthetic and generally accessible.

In the past, we've received positive feedback on the circular metanode layout. This visualization for our previous project took 2nd place for the most aesthetically pleasing network visualization in the Cytoscape 3.2 Launch Challenge.

Methods

We create this visualization in Cytoscape [1, 2] — a Java-based desktop application for network visualization with strong adoption in biology (current version 3.3.0). Creating this visualization is labor intensive and frustrating, since our hetnets push Cytoscape to its limits.

To make the visualization possible, we limit the number of edges per type to 5,000 (by setting max_edges = 5000). One side effect is that Cytoscape only shows the subset of nodes connected by the selected edge subset. Hence, the visualization moderately reflects the number of nodes per metanode and poorly reflects the number of edges per metaedge.

Metapath counts by metanode pairs

This is a new visualization we're trying out that is based solely on the metagraph. The plot shows the number of metapaths (types of paths) that connect a source and target metanode for a given length. The Length 1 condition shows the number of metaedges connecting two nodes. The longer lengths help show the combinatoric explosion in types of connectivity on the hetnet. Here's the graph for Hetionet v1.0 (notebook):

Hetionet Metapath Counts

  • Antoine Lizee: Beautiful - why not the complete square? I find it easier to read and the remaining space is left blank here anyway.

Chord diagram of edges per type

Chord diagrams, also called radial network diagrams, consist of nodes laid out as segments in a circle and edges as chords connecting the segments. In our example, metanodes are laid out on along the perimeter with chords corresponding to metaedges:

Hetionet Chord Diagram

Note that we transform sqaure root transformed the edge count for each metaedge, represented with chord width. The segment width for metanodes does not correspond to the proportion of total nodes which may be slightly confusing.

Chord diagrams were popularized by the Circos app [1]. We created our visualization the the R circlize package [2] (notebook).

Chord diagram of edges?

Another option is to explore a chord diagram showing actual edges (see Fig. 13B in [3]). I'm hesitant to invest time here, but let us know if you think a chord diagram of edges is promising.

Hive plots

Martin Krzywinski — creator of Circos which led to the technology for making our chord diagram — also created a type of visualization called a hive plot [1]. Hive plots lay nodes out along lines which extend radially from a center point. Edges are drawn as curved lines between nodes. The most mature method for generating hive plots looks to be the jhive Java application.

  • Antoine Lizee: Thanks for the reference - great read. It seems hard to implement without easy-to-use tools. Will you give it a try?

  • Daniel Himmelstein: I created a DOT file for a subnetwork of 1000 random nodes. I struggled with the jhive v0.2.7 GUI — I couldn't figure out how to assign each node type to its own axis. The next steps would be to look into the Python hive plots packages pyveplot and hiveplot. However, I'm suspicious whether hive plots will be able to handle the complexity of our hetnet. The jhive implementation seems to be limited to three axes.

  • Daniel Himmelstein: I think we'd need at least 7 axes: SE + PC, C, G, A, D, S, BP + CC + MF + PW. Ideally, we could break from the polar coordinate system, so not all node-alignment-axes have to start from the same origin.

How about this?
Just tweaking settings in Cytoscape
daniel_net

@sergiobaranzini, very nice. Arranging compounds and diseases in a line helps communicate our application of Hetionet to predict drug efficacy. Below is a labeled, landscape version:

hetionet v1.0 labeled landscape

I wanted a black background version of the figures, so I quickly color rotated and inverted the images. I couldn't figure out how to upload figures on thinklab - perhaps I don't have access to the project manager. In any case, you can generate them yourself easily with this command:

convert hetionet-v1.0-labeled-landscape.png -modulate 100,100,0 -negate hetionet-v1.0-labeled-landscape-invertcr.png

Thanks to @dhimmel's note below:

hetionet-v1 0-labeled-landscape-invertcr

hetionet-v1 0-labeled-invertcr

 
Status: Open
Views
225
Topics
Referenced by
Cite this as
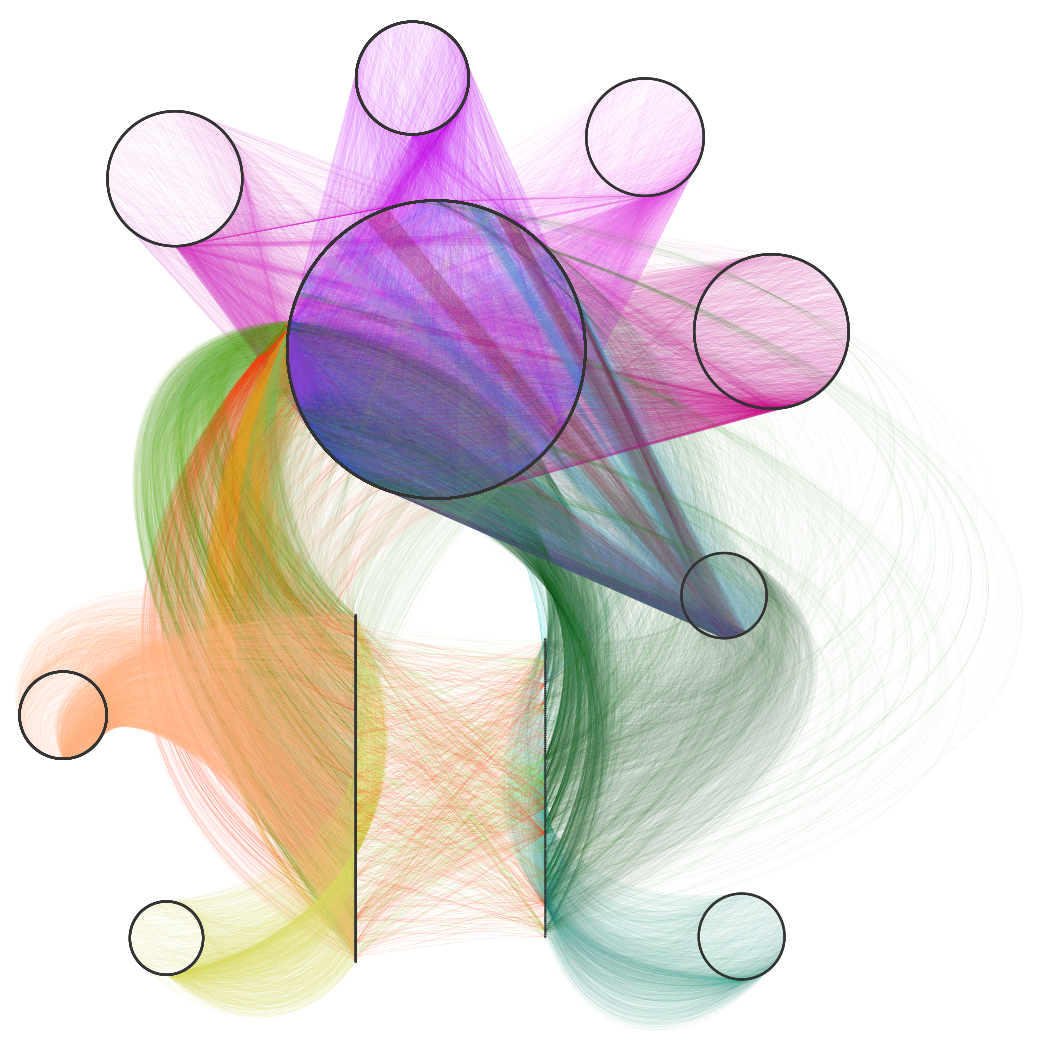
Daniel Himmelstein, Sergio Baranzini, Casey Greene (2016) Describing Hetionet v1.0 through visualization and statistics. Thinklab. doi:10.15363/thinklab.d202
License

Creative Commons License

Share