Project:
Rephetio: Repurposing drugs on a hetnet [rephetio]

Measuring user contribution and content creation


We're planning to release our first project report soon, which will cover the completed hetnet. We'd like to assess the amount of user contribution and content creation the Thinklab venue has facilitated thus far. With the new project export feature, we can now perform custom analytics.

Using today's export, I calculated some basic stats (notebook). The 67 discussions in our project (comments + notes) contain:

  • 403 comments and 133 notes containing 662,501 characters
  • contributions from 40 users who have written a comment or note
  • 248 unique DOI references to 39 different DOI registrants

@alizee is creating a visualization of user contribution over time, so stay tuned.

We adapted one of the graph shown in the thinklytics dicussion for the scope of the rephetio project (R-script), as well as the few numbers that @dhimmel shared above(R-script).

We include in the graph only the 33 users that have written more than 500 characters, highlighting the 8 top contributors with more than 5 thousands.

Evolution of individual contributions

  • Antoine Lizee: CHANGELOG:
    - better counting of total number (relied on the cumulative density before)

We also created the stream chart that shows instantaneous instead of cumulative contribution over time. I removed the main project owner, @dhimmel, to highlight the patterns outside of his massive contribution. These counts are not transformed.

User contribution stream chart

Updated contribution stats & visualization

I updated @alizee's contribution plot with contribution data up to 2016-10-18:

rephetio contribution

The figure caption from our forthcoming project report is:

This figure shows Project Rephetio contributions by user over time. Each band represented the cumulative contribution of a Thinklab user to discussions in the Rephetio project. Users are ordered by date of first contribution. Users who contributed over 4,000 characters are named. The square root transformation of characters written per user accentuates the activity of new contributors, thereby emphasizing collaboration and diverse input.

The notebook that creates the visualization also contains project contribution stats across all Rephetio discussions, which at time of writing total:

  • 80 discussions
  • 488 comments
  • 161 notes
  • 44 contributors, 36 of which were from the community (non-team members)
  • 680,121 characters
  • 108,699 words (equivalent in volume to ~15.53 journal publications, based on an estimate of 7,000 words per publication)

If in addition to discussions, the stats include project documents — which at the moment only includes the proposal [1], but will include the report once published — the summary is:

  • 445 total cited DOIs
  • 698,830 total characters
  • 111,425 total words (equivalent in volume to ~15.92 journal publications)

Rephetio Contributions as of 2017-02-07

I updated the figure above to be current and increased the character threshold for name display to 4,500 (notebook). Here's the new figure:

Rephetio Thinklab Contibution Plot

And here are the new discussion statistics from the notebook:

  • 86 discussions
  • 607 comments
  • 190 notes
  • 48 contributors, 40 of which were from the community (non-team members)
  • 815,744 characters
  • 130,128 words (equivalent in volume to ~18.59 journal publications)

If in addition to discussions, the stats include project documents — which now includes the project report [1] in addition to the proposal [2] — the summary is:

  • 639 total cited DOIs
  • 901,672 total characters
  • 143,056 total words (equivalent in volume to ~20.44 journal publications)

Wow!

 
Status: In Progress
Views
87
Topics
Referenced by
Cite this as
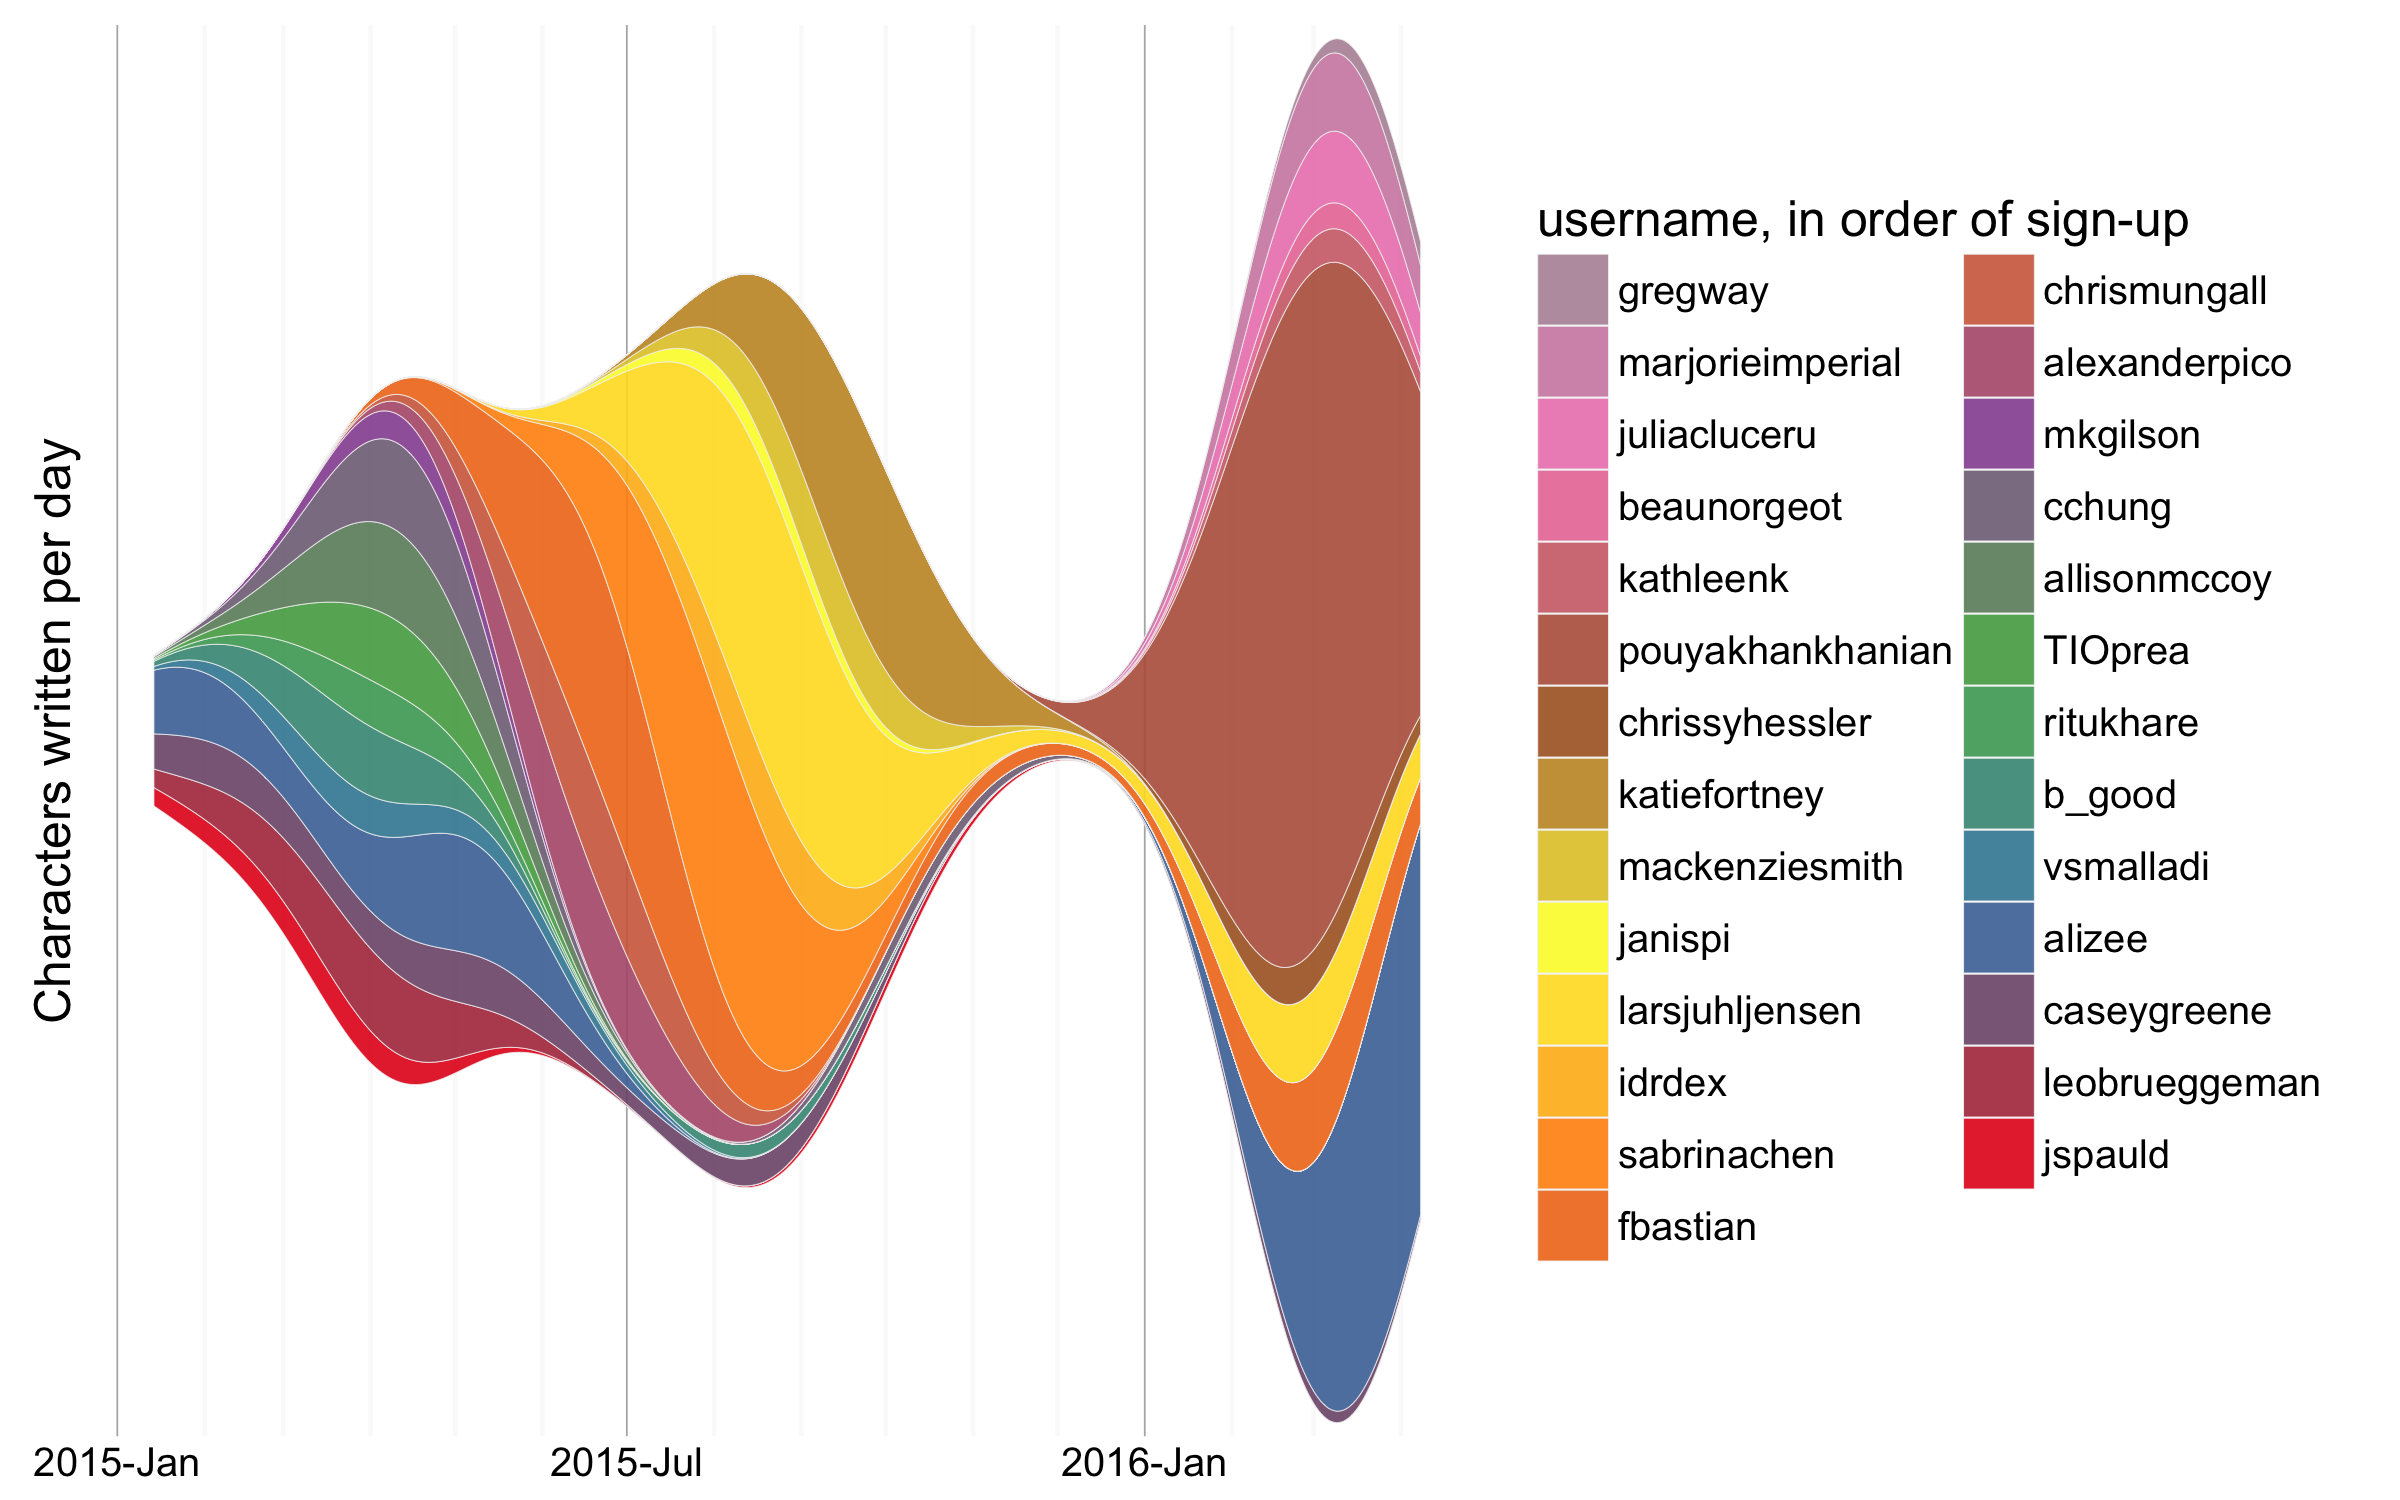
Daniel Himmelstein, Antoine Lizee (2016) Measuring user contribution and content creation. Thinklab. doi:10.15363/thinklab.d200
License

Creative Commons License

Share