Project:
Rephetio: Repurposing drugs on a hetnet [rephetio]

Our hetnet edge prediction methodology: the modeling framework for Project Rephetio


Background

This discussion will describe the machine learning pipeline used by Project Rephetio to predict the probability that a compound treats a disease. Our method derives from a 2011 study to predict coauthorship [1] and our 2015 study to predict disease–gene associations [2]. Several months of investigation by @alizee, @sergiobaranzini, and I have led to several advances in our algorithm, which we call metapath-based hetnet edge prediction or HNEP for short.

The founding principal behind HNEP is to identify types of paths (metapaths) that can predict whether two nodes are connected. For Project Rephetio, we are modeling whether a compound (source node) treats (prediction edge) a disease (target node). For each compound–disease pair (observation), we extract the prevalence of specific metapaths from the hetnet using a metric called degree-weighted path count (DWPC). The DWPC quantifies the number of paths between a source and target node, while adjusting for network degree along the path [2]. The degree-weighting downweights paths through high-degree nodes, which by their nature tend to be less informative.

From the hetnet, we extract a feature matrix whose rows represent compound–disease pairs and whose columns represent features (the vast majority of which are DWPCs corresponding to specific metapaths). Some observations are positives (treatments in our case) and some observations are negatives (non-treatments in our case). We fit a logistic regression model that takes features as input and predicts the probability of treatment as output.

Since we have many features, we use regularization when fitting our regression models, which penalizes complexity to prevent overfitting and accommodate correlations between features. We use two specific cases of elastic net regularization [3]: the ridge and the lasso. Both perform coefficient shrinkage but lasso also performs variable selection. We use the glmnet package in R to fit our models, which implements cross-validation to choose an optimal regularization strength [4]. The logistic regression model is responsible for learning how to predict treatments from the network-based features.

Next, we'll describe the detailed machine learning pipeline used in Project Rephetio.

Machine learning pipeline

Observations. We identified all compounds and diseases that are connected by at least one edge resulting in 1,538 compounds and 136 diseases. Hence, we have 209,168 possible compound–disease pairs. 755 or 0.36% of these pairs are treatments and 390 or 0.19% are palliative (see indications).

Features. We have three types of features:

  1. The prior is a single feature equal to the logit-transformed prior probability of treatment. The prior incorporates the probability that a compound treats a disease based only on their treatment degrees.
  2. Degree features correspond to each metaedge that connects either a compound or disease. In total we have 16 degree features, 8 for compound degrees and 8 for disease degrees. Degree features count either the compound or disease degree for a given metaedge and thus only depend on either the source or target node. Degree features are IHS transformed.
  3. DWPCs make up the vast majority of features. Each DWPC corresponds to a metapath. We consider the 1,206 metapaths that traverse from compound to disease and have lengths 2–4. We use w = 0.4 as the damping exponent when computing DWPCs. DWPCs are mean scaled and IHS transformed.

Stages. The DWPC features are computed by querying the Neo4j graph database. The queries are computationally intensive. Thus far, our runtime bottleneck has been network traversal. Computing all 252,256,608 DWPC queries (209,168 observations × 1,206 DWPCs) is impractical. Accordingly, we adopted a shortcut by splitting the machine learning process into two stages: the all-features stage and the all-observations stage.

Stage 1: all features

The purpose of the all-features stage is to assess feature performance and perform feature selection. For this stage, we include all 755 positives but randomly select 3,020 negatives (4 × the # of positives).

In addition to the unpermuted hetnet, we compute DWPCs on 5 permuted hetnets. For each permuted hetnet, we compute features for the 755 positives and 3,020 random negatives corresponding to that permutation (referred to as primary observations). We also compute DWPCs for any observations that were assessed on the unpermuted network but were not primary observations for a given permuted hetnet.

In total, we computed 46,867,572 DWPCs for the all-features stage. Computing these DWPCs took 4 days and 11 hours using a multithreading approach to perform up to 12 queries in parallel (notebook).

On the all features dataset, we identified how to transform DWPCs to address their highly skewed distribution. We also learned how the prior probability of treatment affects model performance. This investigation led us to include the prior_logit feature mentioned above.

For each feature, we computed several measures of performance. These feature-specific performance measures indicate whether the DWPCs for a given metapath reliably discriminate whether a drug treats a disease. We use this information to filter the majority of DWPC features, which are not predictive or suffer from an edge-dropout contamination issue. The DWPCs from permuted hetnets are used here as baseline measures to assess the contribution of edge specificity.

Stage 2: all observations

Proceeding with the metapaths selected in Stage 1 (see next comment), we compute DWPCs for all 209,168 observations on the unpermuted hetnet. After transforming the degree and DWPC features, we standardize all variables besides the prior. Standardization allows us to decompose the linear predictor to assess each feature's contribution to a prediction compared to its mean.

We fit a logistic regression model with the prior, the degree features, and the selected DWPC features. However, this model is fit only on the 29,799 observations with a non-zero prior. From this model, we predict the probability of treatment for all observations. We enable predictions for zero priors by setting the prior for every observation equal to the mean prevalence of positives. Hence, it's important that the model assigns a coefficient near 1.0 to the prior_logit feature. In essence, we're erasing the effect of how many treatments each compound and disease have, since this knowledge is otherwise overpowering. The end result is a treatment-degree-naive prediction of whether each compound treats each disease.

Selecting features for Stage 2

One major goal of Stage 1 is to select a subset of DWPC features to calculate on all observations. We've considered three methods for this selection.

Method 1

The first method is to use feature-specific performance measures as selection criteria. This method allows the user to define the characteristics of a promising feature. For example, the user could select only features that will lend themselves to interpretation.

Method 2

The second method is to use the lasso to select features [1]. Since we find the optimal regularization strength using cross-validation, each modeling fit will be slightly different. Therefore, we fit many models, each time varying the random seed, and identify features which were selected by at least a given percentage of the models. The advantages of this method are that it considers how features perform in a model rather than alone. Hence, it is adept at identifying features with a unique contribution and can avoid selecting collinear (redundant) features [2]. The downside of this method is that it can select features that are not marginally informative but are helpful covariates. While this improves model goodness of fit, it can lead to difficultly in interpreting the model and understanding why a given prediction was made.

Method 3

Method three involves performing Method 1 and then Method 2. This combined approach makes sense if the user-guided selection of Method 1 results in a large number of features. If extra feature selection is warranted by computational constraints, then Method 2 can be applied on top of Method 1.

Our choice

We went with Method 1 and defined the following inclusion criteria for a DWPC feature (notebook):

  • delta_auroc > 0 and fdr_delta_auroc < 0.05 to select informative features
  • pdwpc_primary_auroc > 0.5 to guard against edge dropout contamination
  • rdwpc_auroc > 0.55 to select informative features and guard against edge dropout contamination

These filters reduced our number of DWPC features from 1,206 to 142. Since we could compute 142 features on all observations, we skipped Method 2. The choice to rely on Method 1 was driven by desire to address edge dropout contamination and select features that are insightful.

Refining our Stage 2 modeling approach

Here we'll describe how we fit the model on the all observations dataset for Stage 2. Remember that the model is fit only the 29,799 observations with a non-zero prior. We fit an elastic net with α = 0.2 [1]. We chose the elastic net mixing parameter (α) to balance model parsimony (which aids interpretation) and retaining pharmacologically-meaningful features.

Despite our efforts to remove features susceptible to edge dropout contamination during Stage 1 feature selection, several features were getting incorporated into the Stage 2 model that showed evidence of contamination: features with treats relationships receiving negative coefficients when their marginal association with treatment is positive. Hence, I manually assembled a feature blacklist, which I iteratively added features to that were showing evidence of contamination. In total, 22 features were blacklisted.

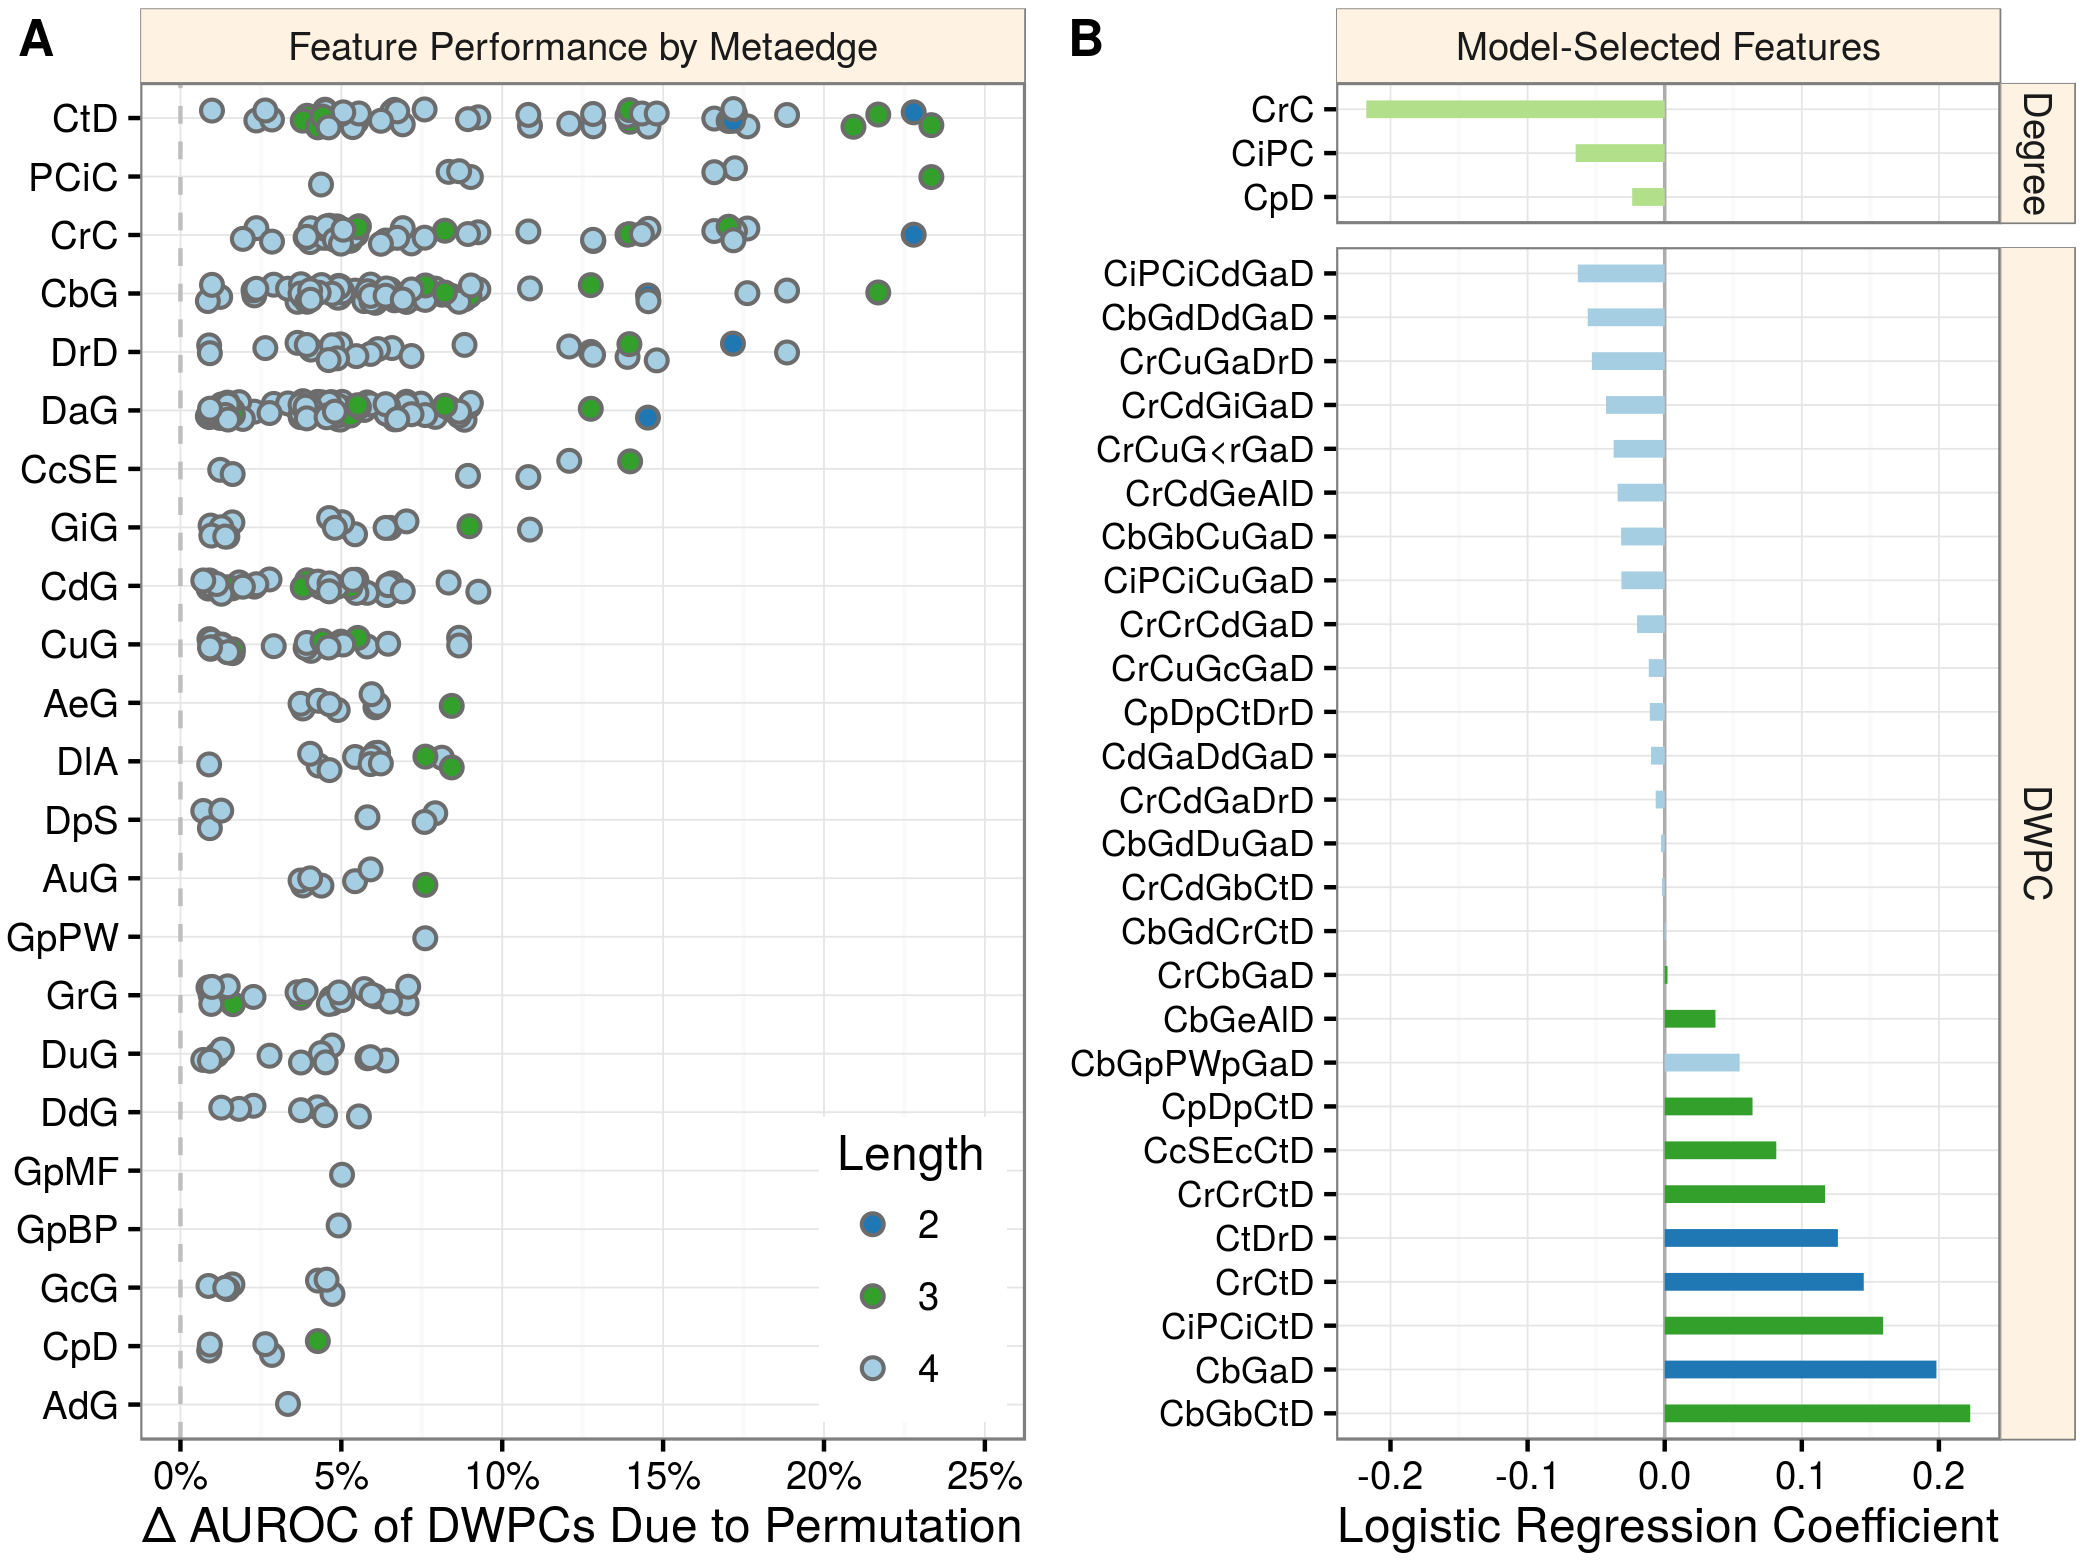
Ultimately, the model was fit on 138 features and assigned 18 negative and 13 positive feature coefficients (notebook, coefficient table). The negative coefficients seem to serve as covariates by adjusting for unspecific node degree effects. While we included separate degree features for this purpose, the DWPCs seem to have been preferred by the model.

Such a small number of positive coefficients is a bit disappointing. Our feature assessment (here and in Panel A below) shows that a broad range of metapaths are informative. The origin of our model's selectivity appears to lie with the “one-standard-error” rule [2] we use to identify the optimal regularization strength (λ). Our model had high cross-validated standard error leading to substantial regularization on top of the deviance minimizing model. While it's tempting to relax our λ selection, I'd rather be more confident in a minimalist model than risk a less coherent but more complex model.

Visualizing feature contribution

Panel A below shows the performance of each of the 142 selected DWPC features. Metapaths are organized by their constituent metaedges. Here we see that our feature selection approach retained features that cover diverse types of information. In fact, the only metaedge that lost all of its features was Gene–participates–Cellular Component.

Feature performance and modeling

Panel B shows the non-zero model coefficients from the Stage 2 model. Note that the invariant term coefficients are not shows (the intercept and the prior).

GitHub Repository

I just touched up the machine learning repository for Project Rephetio, dhimmel/learn on GitHub [1]. Mainly, I created a lot more documentation. However, since it's quite a complex repo with lot's of notebooks and pieces, users will still likely have questions. So don't hesitate to open issues with requests for additional documentation.

Feature / machine learning diagram

Here's didactic diagram illustrating the classification problem and features composing Rephetio's machine learning. The diagram is created using real data (notebook), but only shows a subset of observations (compound–disease pairs, rows) and features (metapaths, columns). The diagram shows the feature matrix (continuous values, from the "all observations" stage) as well as treatment status (binary values).

Rephetio Machine Learning Diagram

The top six compound–disease pairs are not treatments (negatives, gray), while the bottom six are treatments (positives, green). Each column is a feature corresponding to a metapath. Use this table to lookup metapath abbreviations. For example, CbGiGaD is shorthand for Compound–binds–Gene–interacts–Gene–associates–Disease.

Feature values are transformed and standardized DWPCs, which assess the connectivity along the specified type of path between the specific compound and disease. The maroon colored values indicate above-average connectivity, whereas the blue colored values indicate below average connectivity. In general, positives have greater connectivity for the selected metapaths than negatives.

The logistic regression model predicts whether a compound–disease pair is a treatment based on its features. In essence, the model learns the effect of each type of connectivity (feature) on the likelihood that a compound treats a disease.

 
Status: Open
Views
126
Topics
Referenced by
Cite this as
Daniel Himmelstein (2016) Our hetnet edge prediction methodology: the modeling framework for Project Rephetio. Thinklab. doi:10.15363/thinklab.d210
License

Creative Commons License

Share