Project:
Rephetio: Repurposing drugs on a hetnet [rephetio]

Publication:
DrugBank 4.0: shedding new light on drug metabolism

Protein (target, carrier, transporter, and enzyme) interactions in DrugBank


DrugBank contains four types of drug-protein interactions:

  • Target: A protein, macromolecule, nucleic acid, or small molecule to which a given drug binds, resulting in an alteration of the normal function of the bound molecule anda desirable therapeutic effect. Drug targets are most commonly proteins such as enzymes, ion channels, and receptors.
  • Enzyme: A protein which catalyzes chemical reactions involving the a given drug (substrate). Most drugs are metabolized by the Cytochrome P450 enzymes.
  • Transporter: A membrane bound protein which shuttles ions, small molecules or macromolecules across membranes, into cells or out of cells.
  • Carrier: A secreted protein which binds to drugs, carrying them to cell transporters, where they are moved into the cell. Drug carriers may be used in drug design to increase the effectiveness of drug delivery to the target sites of pharmacological actions.

We extracted DrugBank-protein interactions (notebook, download). Our resource includes all DrugBank interactions that met the following criteria:

  1. The interaction is between a drug and single protein. A target which is "protein group" and contains multiple uniprot proteins would be excluded. Examples include the GABA-A receptor (anion channel) and NMDA receptor. Likewise, a target which is not a protein, such as DNA or Phosphate, would be excluded.
  2. The protein maps to an entrez gene. Some uniprot proteins did not such as Q7ZJM1, Q59GM9, and Q53ET4 — all TrEMBL (unreviewed) terms with low annotation scores.

In total, we extracted 19,906 interactions for 5,878 drugs and 3,757 genes.

Similarities between associated genes in drug compounds

Notebook

Objective:

We wanted to visualize the similarities among the associated genes for drug pairs in each of the four types of drug-bank interaction categories. To do so we extracted data from various sources to compile drugs with associated genes and the compound similarities between pairs of drugs compounds.

The Data:

We extracted DrugBank-protein relationships which lists drug types and associated genes, as well as compound similarity data which gives a value between zero and one based on the chemical similarity of a pair of drugs.

Jaccard Values and Initial Visualization:

Our first step was to create a dataframe with combination of compound pairs. Each compound is associated with a certain number of genes and we were able to define a Jaccard function to calculate the Jaccard value of the overlapping genes in each compound pair. It was noted – as expected — that the wide majority of the compound pairs had no similar genes, with a Jaccard value of zero. The drug-protein interactions were then categorized into four subgroups: carrier, enzyme, target and transporter. The similarity data was added for each compound pair. All five categories were graphed on a Seaborn PairGrid using a histogram on the univariate level and a hexbin scatterplot on the bivariate level.

Analysis of PairGrid Jaccard Value Visualization:

The data for each of the graphs did indeed center around zero, meaning that most compounds had no genes in common. In fact, the data was so skewed in the histogram that we needed to use logarithmic bins. Though the data was skewed right towards zero and dipped around 0.9 for each category, the histograms showed that there was also significant data for the Jaccard value of one, so that the graphs had U-shaped figures. This means that there are some compound pairs with all genes in common. In terms of the hexbin scatterplots, the darkest areas were zero and one, which reflected what was observed in the histograms. One other interesting trend to note are that for carrier and transporter, the data also concentrated around 0.5 and 0.33.

Figure 1: Compares Jaccard values for each drug-protein interaction category and chemical similarity

Mean Jaccard Pointplot:

We used the Seaborn Pointplot to visualize the data in a different way. The means of Jaccard values were calculated for each of the four protein-interaction categories. With the similarity on the x-axis and the mean of Jaccard on the y-axis, it was concluded that the mean Jaccard peaked when the similarity was about 0.8 to 0.9. The general upwards trend was expected, as increased compound similarity should indicate an increase of gene overlap. By far, the target category had the most dramatic increase in mean Jaccard value. Though it started with a pretty flat mean Jaccard value at zero, it increased rapidly to hit a mean Jaccard value of nearly 0.5 at similarity=0.8.

Figure 2: Demonstrates relationship between chemical similarity of compounds and the mean Jaccard values

Similarity Threshold:

The final visualization we created was a series of complex barplots to compare a similarity threshold among the four category groups. The similarity values were replaced with zero or one depending on whether the original value was greater or less than 0.5. Next, contingency tables were created for each category so that relative frequencies could be calculated.

The visualization showed that similar compounds are likely to have common targets. For example, if two compounds shared a transporter, they also shared a carrier 25% of the time, compared to 5% of the time if they did not. This trend continued throughout each of the bar graphs and was particularly notable in the comparisons with similarity. Note that the y-axis’s are labeled differently for easier reading.

Figure 3: Illustrates similarity threshold among the drug-protein interaction categories and chemical similarity

Great work @sabrinachen! Your analysis reveals many interesting findings.

First, chemical similarity is a strong indicator that two compounds share a target (Figure 2). One of the most successful target prediction algorithms, named the Similarity Ensemble Approach (SEA) [1], is based on this very observation. Our data shows an enrichment of shared protein interactions above a chemical similarity threshold of 0.5. Interestingly, when binarizing chemical similarity scores, SEA also chose a cutoff of 0.5 (source).

Second, when two proteins share proteins of a specific category, they are more likely to share proteins of other categories (Figure 3). For example, when two compounds share a transporter, they have a 14% chance of sharing an enzyme, compared to 3% otherwise. This trend applies to all categories but is most pronounced between chemical similarity and target similarity.

Finally, it would be interesting to know how many compound pairs were included for each chemical similarity bin in Figure 2.

I contacted Mike Keiser, the human intellect behind SEA, regarding chemical similarity thresholding. Below and with permission, I've posted his reply to our above comment:

The 0.5 measure refers to a tanimoto coefficient on daylight path-based fingerprints. It'd be in the supplemental materials and/or methods of Keiser et al, Nat Biotechnol, 2007 [1]. So I think the closest equivalent in rdkit would be tanimoto instead of dice coefficient, or rdkit-path fingerprints. Using ECFP4 (i.e., Morgan with radius 2 in rdkit) and a tanimoto coefficient, we found cutoffs more around 0.28 (the range can vary pretty substantially depending on fingerprint type used). In general, 0.5 is considered pretty high similarity for ECFP/Morgan fingerprints at least with tanimoto coefficients (I'm less sure of the Dice coefficient equivalents, off-hand).

 
Status: Completed
Views
994
Topics
Referenced by
Cite this as
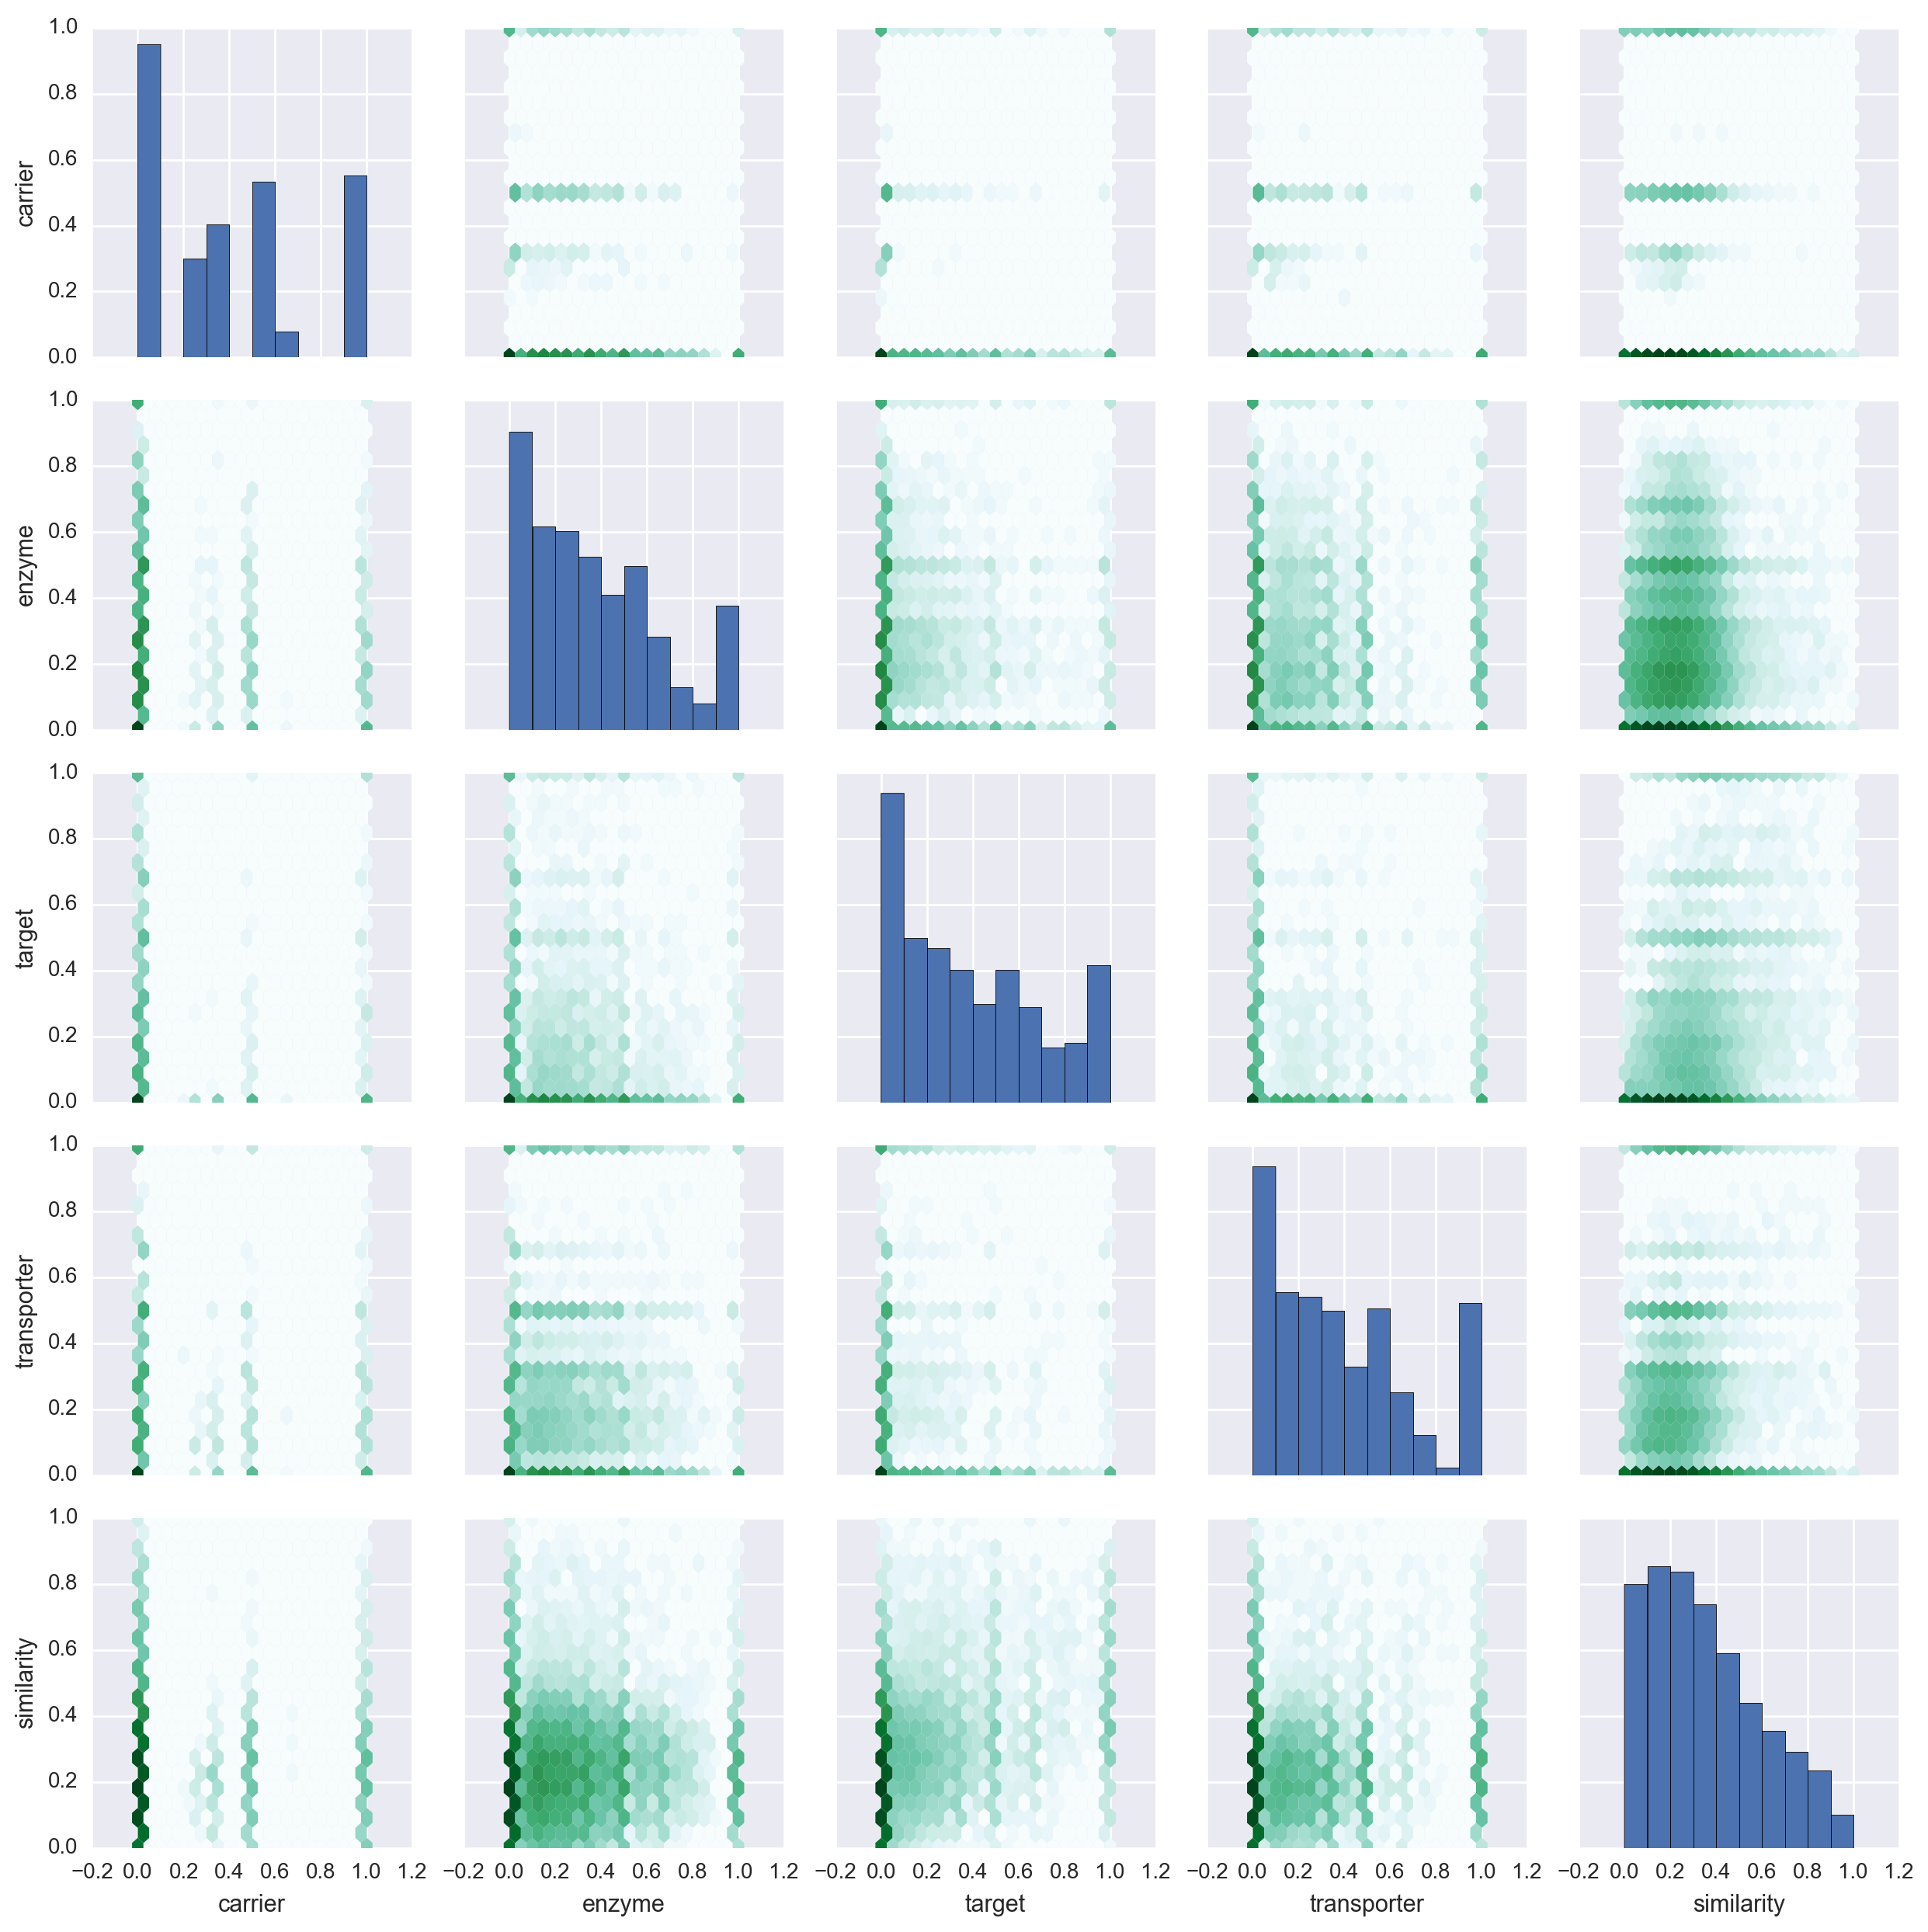
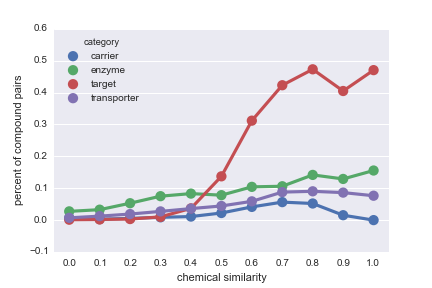
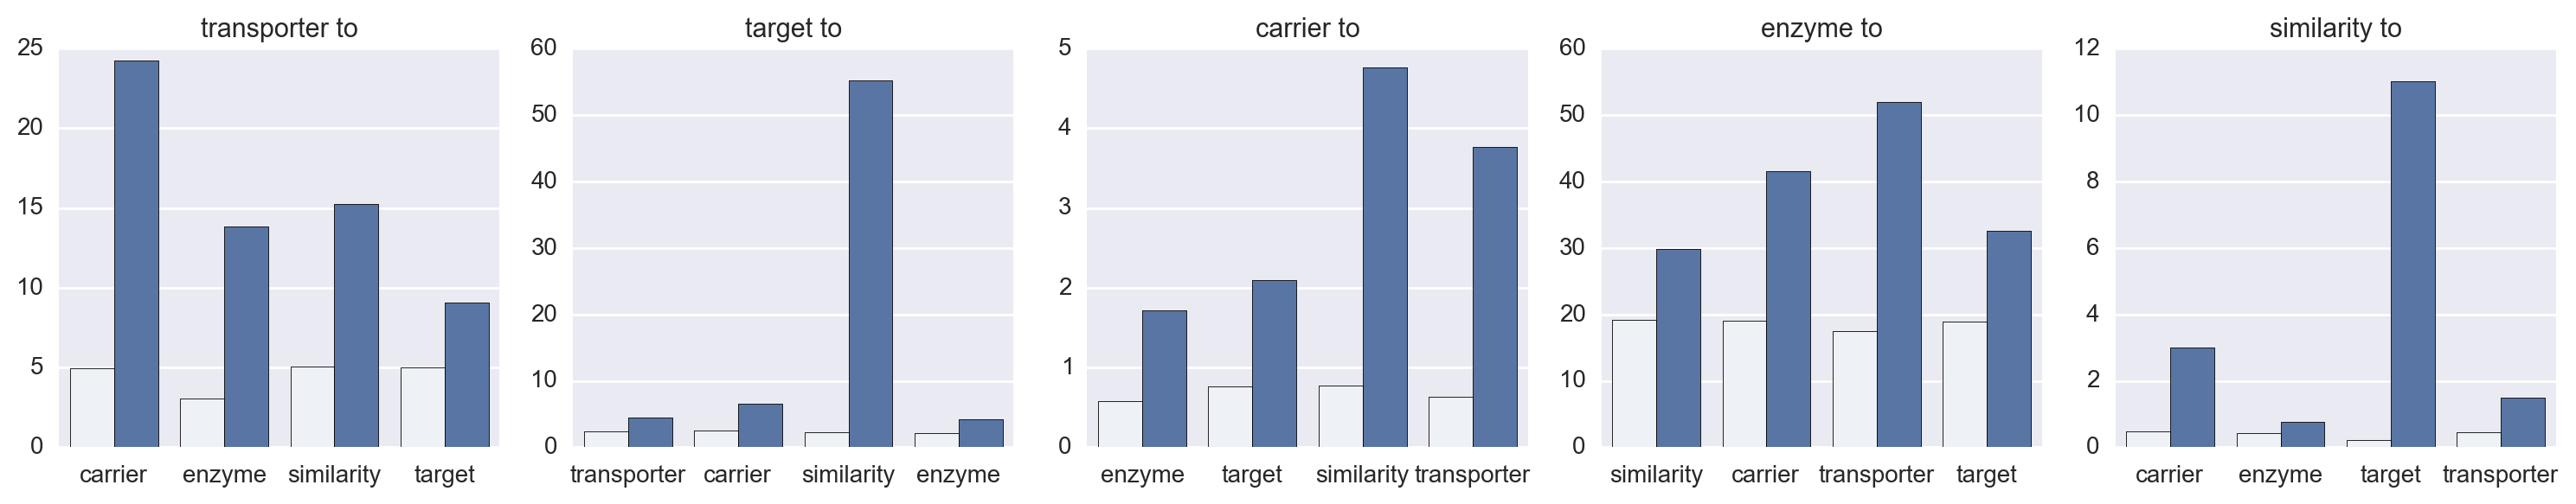
Daniel Himmelstein, Sabrina Chen (2015) Protein (target, carrier, transporter, and enzyme) interactions in DrugBank. Thinklab. doi:10.15363/thinklab.d65
License

Creative Commons License

Share