|
|
|
|
Status:
Completed
Views
241
Topics
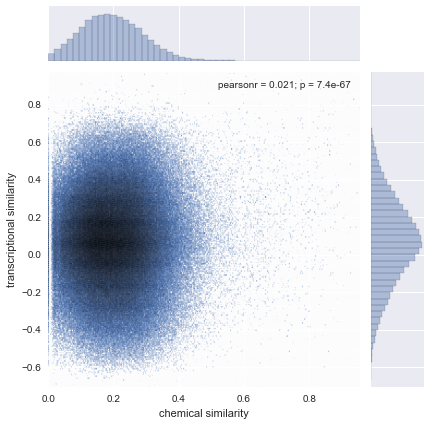
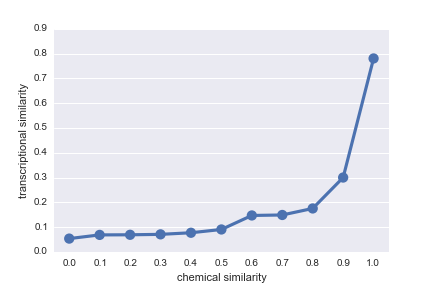
DrugBankStructural SimilarityFingerprintDice coefficientMolecular SimilaritySimilarityChemical Similarity
Referenced by
Cite this as
Daniel Himmelstein, Sabrina Chen (2015) Calculating molecular similarities between DrugBank compounds. Thinklab. doi:10.15363/thinklab.d70
License
Share
|